

Rethinking Recruitment: Two Case Studies on How to Improve Clinical Recruitment Rates
Staff from the Center for Research Process Improvement at Tufts Clinical and Translational Science Institute (Tufts CTSI) often use a continuous quality improvement framework to problem solve when they approach a researcher or project facing operational challenges. They recently partnered with Tufts CTSI’s Recruitment and Retention Support Unit and Multi-site Clinical Research Center to rethink the process for providing consultations to researchers. This new cross-functional team meets with study teams to understand the barriers and facilitators to recruitment and how they can select recruitment strategies using a data-informed approach.
The new process is highlighted in two case studies: The first case study highlights how they use quality improvement tools to prioritize recruitment strategies with study teams. The second case study outlines how using clinical trial metric dashboards can help teams to make data-informed decisions. Both case studies are examples of the importance of focusing on the science of science, as well as the science itself.
Further quality improvement tools and examples are highlighted in the research process improvement toolkit.
Case Study 1: Optimize Clinical Trial Recruitment Using Quality Improvement Tools
One of the most challenging aspects of conducting clinical research is recruiting and retaining participants. Even a well-designed study won’t succeed if it lacks a robust recruitment and retention plan. Tufts Clinical and Translational Science Institute’s (Tufts CTSI) Center for Research Process Improvement, Recruitment and Retention Support Unit, and Multi-site Clinical Research Center have been partnering with research study teams to explore how using quality improvement (QI) tools can help study teams to think strategically about their recruitment plans and enhance their overall recruitment approach.
Recently, Tufts CTSI worked with two study teams who were actively recruiting specific populations for two clinical trials. With both study teams, we used key driver diagrams and prioritization matrix tools to understand contributors to successful participant recruitment and to prioritize actions to improve recruitment rates. Prior to completing the key driver diagram, we needed to understand the barriers and facilitators to recruitment with each team. We worked with them to complete a list of all barriers and facilitators and catalogued each on a comprehensive spreadsheet.
Key Driver Diagrams
A key driver diagram is used to visualize the drivers, or conditions, that could affect achieving a project’s goal such as recruiting the needed number of participants. It shows the relationships between different drivers and how they influence reaching the goal. The diagram also lists actions or operational changes that may impact the drivers. The change ideas in this case are different recruitment strategies the study team could use to improve their accrual rates.
We met with both study teams to understand their recruitment approaches, desired study populations, and the overall recruitment environment, using the information to draft key driver diagrams for each study. The barriers and facilitators we collected from the study teams were also used to inform the key driver diagram. Although each driver diagram was specific to its respective project, both diagrams included similar conditions and actions that could lead to improved participant recruitment. See Figure 1 for a generic key driver diagram that can be adapted for other clinical studies planning to recruit participants.
Figure 1. Recruitment Key Driver Diagram
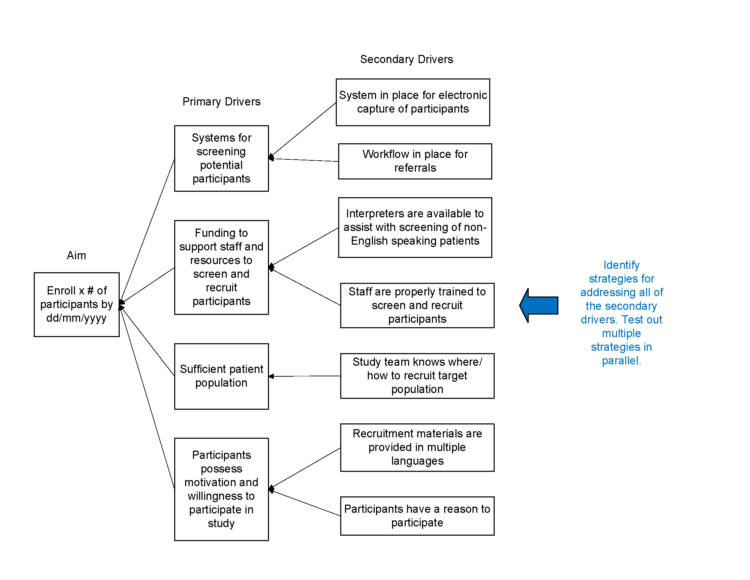
Description of Recruitment Key Driver Diagram.
Prioritization Matrix
A prioritization matrix is a tool that helps compare actions in order to decide which actions, or change strategies, have the greatest priority, the most impact, or are the easiest to accomplish. Using a prioritization matrix can help a group of stakeholders achieve consensus in strategy prioritization and avoid or resolve disagreements.
Using the results of the key driver diagram, the study team reviewed the list of possible actions or changes to the existing recruitment process. Next, we helped the team sort the change strategies in a prioritization matrix based on the potential impact of the strategy to increase recruitment and the level and effort required to implement the strategy. After sorting all the strategies into the matrix, the team began implementing those strategies that had high impact but required low effort. See Figure 2 for a blank prioritization matrix you can use for your own research study.
Figure 2. Prioritization Matrix
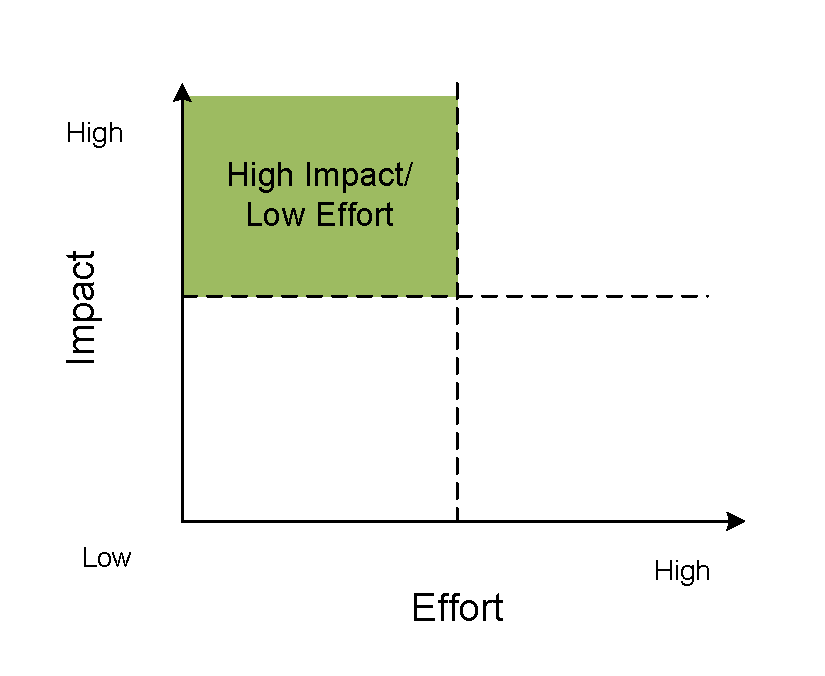
Description of Prioritization Matrix.
Key Takeaways
The driver diagram and prioritization matrix are tools to help study teams organize their thinking and planning around improving participant recruitment. Deploying a key driver diagram helps teams systematically identify effective changes and develop a stronger recruitment plan. The prioritization matrix helps teams avoid feeling overwhelmed by the numerous strategies they could use to improve recruitment and ensures the team is focused on the strategies that are both impactful and feasible to implement.
If you have questions on how to use one of these tools and apply them to your research project, please contact Senior Project Manager Alyssa Cabrera, MPH.
Case Study 2: Using Clinical Trial Metric Dashboard Data to Improve Study Operations
Investigators are often keenly aware that industry sponsors collect clinical trial metrics on the research studies and sites they activate for trial participation, but sponsors rarely share these data, trends, and benchmarks with investigators. As a result, investigators may find it helpful to collect their own “in house” metrics. Metric dashboards, which can easily be developed in Excel, provide a study team with an opportunity to reflect on these data and brainstorm solutions for improving key trial performance metrics. Investigators who have access to a clinical trial management system (CTMS) can work with their data teams to see if key metrics can be easily exported from the CTMS or from a custom report.
Recently, a team from Tufts Clinical and Translational Science Institute’s Center for Research Process Improvement, Recruitment and Retention Support Unit, and Multi-site Clinical Research Center partnered with two study teams on collecting key study metrics. Our staff met with each of the teams to help decide which performance measures, and what level of performance, would be most useful for the team’s management of the study. One team prioritized tracking the study visit completion rate; the other team prioritized tracking the screen fail rate. Each team was able to make informed study management decisions based upon the metric results and implement improvements in key operational areas. For example, one team tracked the financial costs of supplying recruitment materials to external research sites. After seeing that few participants were recruited from these sites, and that the recruitment costs were high, the team decided that the external site recruitment strategy was not worth the investment.
If you are new to using clinical trial metrics to manage your research studies, check out the newly-developed resource, Collecting and Using Clinical Trial Metrics to Improve Trial Performance. You can download operational guidelines for key metrics, access a dashboard template, and learn about three key metrics and their importance to study success. Example pages are displayed below.
Figure 1. Example Pages
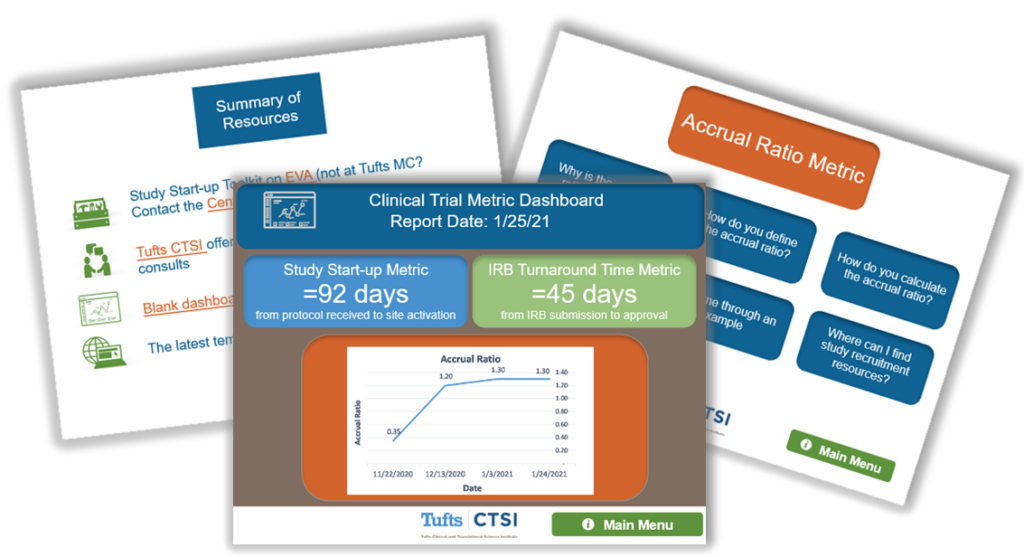
If you have any questions about how you might use clinical trial metrics in your research studies, or how to use these resources, please contact Senior Project Manager Alyssa Cabrera, MPH.